This is the archive page
Inflation in much of the developed world is higher than at any point in the past thirty years. Therefore, we may be able to draw valuable lessons from comparing today’s inflation with other high inflation periods in history.
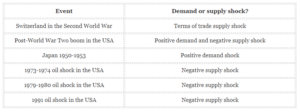
In this context, we examine Swiss supply-driven inflation in World War Two, demand shocks in the United States in 1946 and in Japan in 1950, and the 1970s oil shocks to help illuminate the current crisis.
Key takeaways:
- In the demand shock cases, supply naturally caught up to demand. Inflation came down on its own without central bank intervention.
- The oil shocks of the 70s may appear similar to the shock we face today but there are key differences. Still, they demonstrate that strong central bank responses do affect inflation.
- Supply chain resilience has mitigated supply shock inflation in the past but seems unlikely to do so in the current crisis.
INTRODUCTION
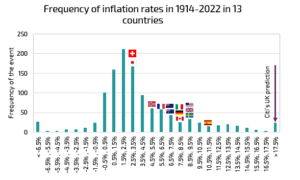
The histogram below shows where the current inflation episode falls in comparison with historical inflation. Currently inflation in most countries – with the notable exceptions of Japan and Switzerland – is towards the tail-end of this distribution.
Since we have moved away from a low inflation regime, analysing other periods of high inflation may prove insightful.
Source: Record, Macrobond
Inflation today is driven by both a strong demand-side – consumer “revenge” spending post covid – and a weak supply side. The six inflation shocks outlined below have been selected because they share some similarities with the present crisis.
WHAT HAPPENED?
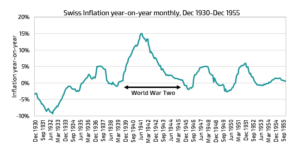
1939-1945 Switzerland: A supply shock caused by war
Switzerland is ringed by Germany, France and Italy. However, in the 20th century it had none of their geographic advantages: no coal and iron like Germany, no rolling fertile hills like France, and no privileged access to Mediterranean trade like Italy.
It is unsurprising then that on the eve of World War Two Switzerland relied on Germany for virtually all its industrial inputs and energy, while it relied on the USA and the Soviet Union for much of its cereal farm products. When war broke out this trade was restricted and became much more expensive.
In response, inflation increased drastically. People substituted away from expensive imports – anecdotally, milk and cheese consumption increased – and where this was impossible, reduced consumption. For instance, energy use decreased by nearly 30%. In many ways this parallels the current energy crisis in Europe, where restrictions on gas are forcing the substitution to other energy sources.
Source: Record, “Historische Statistik der Schweiz” https://hsso.ch/en/2012/h
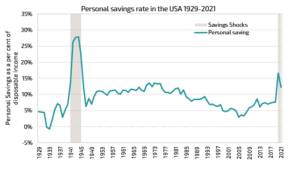
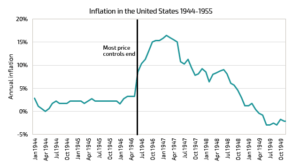
1946-1949 in the United States: A post-war demand boom
The end of World War Two marked the start of the American century. It was leaving behind the lull of the Great Depression and, unlike Europe, its manufacturing capacity was intact. The other “victors” faced a rough decade – food rationing in the UK ended only in 1954 – while in the United States the consumer had (nearly) free choice from 1946.
Despite an intact manufacturing base – the United States mainland was only bombed once and the largest foreign “invasion” numbered eight men – its factories were still tooled to produce tanks and battleships not Cadillacs and refrigerators. Additionally, during the wartime period, people also saved substantially. When rationing ended pent-up demand was unleashed on an unprepared economy and inflation increased drastically
Source: Record, FRED
The high savings rate coupled with pent-up demand parallels Covid-19, but there are still key differences. For instance, the Federal Reserve responded to double-digit inflation with an interest rate increases from about 0.4% to less than 1.5% (data from the Wall Street Journal suggests that the overnight rate only exceeded 1.5% once in 1948 and 1949) by the end of the decade.
Source: Record, Macrobond
However, despite limited Federal Reserve intervention in response to double digit (!) inflation, price levels stabilized and inflation fell as extra supply entered the economy.
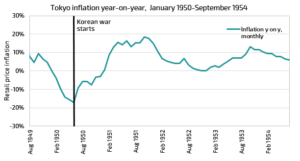
Japan in 1950: US military demand
On June 25th 1950, the United States entered the Korean War. Suddenly the Japanese economy – still recovering from the end of the world war – had significant foreign demand for its goods. Americans needed uniforms and trucks – in fact; US “special procurement” was nearly 40% of Japan’s total exports by 1952.
Source: Record, Official Statistics of Japan
Aggregate demand shocks like these are rare – the demand for an economy’s goods or services does not often drastically increase almost overnight. In this context, Japanese inflation during this period is especially interesting. Annual inflation went from more than 10% negative to more than 10% positive within a year. In this period the Bank of Japan took very little action, but inflation still came down naturally, as Japanese manufacturing responded to increased demand.
The Oil crises
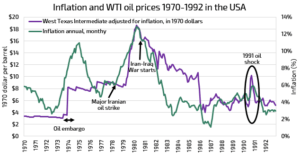
1973 Oil Crisis
In response to the Yom-Kippur war, OPEC targeted a 25% output reduction. Academics dispute whether this had a direct effect: only Kuwait and Saudi Arabia significantly cut output and OPEC’s total oil production actual increased between 1973 and 1974 before falling in 1975. Many attribute oil’s skyrocketing price to instead the “precautionary demand” of rising inventories and a booming economy. Taken together along with a US dollar devaluation, the prices set in the Tehran/Tripoli agreements were no longer the equilibrium prices.
However, the broader effect is clear. With a backdrop of expiring wage and price control in 1973 and expansionary monetary and fiscal policy, inflation skyrocketed in response.
1979/80 Oil Crisis
Like the 1973 crisis, the 1979 oil crisis is often attributed to a supply shock caused by the Iranian Revolution. However, the timing of oil price increases does not match this view. The biggest Iranian production shortfalls occurred in January and February 1979, and Saudi Arabia acted quickly to mitigate these effects. Indeed, in January 1979 – relative to September 1978 – global oil production was 8% lower. By April 1979 the OPEC shortage was zero percent relative to September 1978. However, oil prices peaked a year later in April 1980, before the Iraq-Iran War started.
Still the response inflation in this period warranted was immense – and so famous that it is still taught in economics classrooms around the world. Facing persistent inflation, Volcker and the Federal Reserve Board reduced the money supply severely, and by extension raised the Fed funds rate to historic highs of 20%.
1990 Oil price shock
Unlike the 1973 oil supply shock, which relied on OPEC cooperation – hard to achieve – the 1990 oil shock was a result of the Kuwait-Iraq war and the burning of oil fields. This shock was shorter and less pronounced than previous shocks in the 70s (Fig. 6), but less affected by potentially escalatory factors – like loose monetary and fiscal policies.
Source: Record, FRED
1967 Oil Crisis non-event
In response to the 1967 Six-Day War, OPEC imposed an embargo on much of the West. However, oil prices did not increase. Why?
- Greater resilience: The USA had 1 million barrels per day spare oil production capacity – which it put to use – but this was eroded by 1973 (and hardly exists today).
- Less precautionary inventory demand: greater oil supply resilience meant that precautionary inventory demand did not increase as substantially as in the 1973, 1979 and 1991 oil crises.
CONCLUSION
The present will probably not follow the exact trajectory of previous crises – but we can still take lessons from the past. Several observations stand out:
- When inflation increases were driven by demand increases – in the United States after World War Two and in Japan 1950-1953 – inflation fell naturally without significant government intervention, even in the face of loose monetary policy.
- There are key differences between previous oil shocks and the energy crisis we face today:
- It can be argued that the oil price increases in the 70s were largely driven by precautionary demand and increasing inventories, while the energy crisis in Europe looks likely to be driven by a classic lack of supply.
- Transporting LNG is both difficult and capital intensive tankers capable of holding cargos at temperatures of roughly negative 160 degrees Celsius are not cheap.
- The 1967 oil embargo became a non-event in part because of greater energy supply resilience, especially spare oil supply capacity in the United States. In turn, this became self-reinforcing with little demand to build inventories for precautionary reasons compared to later oil shocks.
- While these are interesting observations, it is important to remember they are anecdotal – there are few high inflation events to draw conclusions from. However if we want to know what happens at the tail-end of a distribution, we should look to other events at the tail-end, so this problem is unfortunately unavoidable. Still, this does affect our confidence in our conclusions when applying them to investing in the current environment..